
One of the new features in the ConfigMgr 1906 release (and in previous tech preview releases) is the task sequence debugger. See the What’s new documentation that talks about it, and the official documentation that walks through using it and lists known issues. Since this is still a pre-release feature, make sure you enable it too. I consider it a pretty harmless thing to enable – it’s not like this is something you’re going to use on thousands of machines. Rather, you would use this to work out kinks or issues in your task sequence on a machine that you control. (If you are skittish, you can try it in your lab environment using the current tech preview release.)
If you remember back to the MMSMOA event in 2017, this was a hackathon project that gathered a lot of attention. It took a while, but it’s finally part of ConfigMgr.
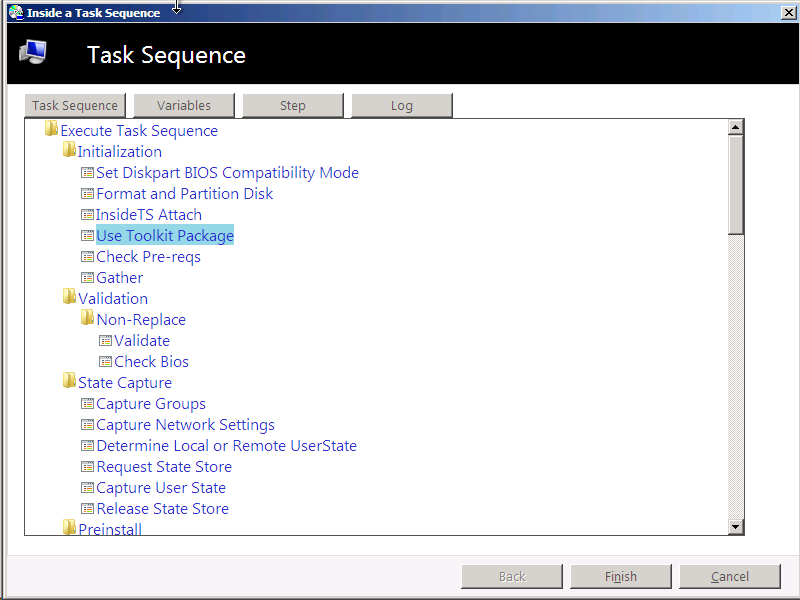
But how many of you remember back to the BDNA webcasts in 2011 (and MMS that same year) where I had a session about “Inside a Task Sequence” that included the original hacked-up task sequence debugger? You can read more about that in a blog that I posted in 2012 with all the details:
https://blogs.technet.microsoft.com/mniehaus/2012/04/20/inside-a-task-sequence/
Of course I couldn’t change the source code, so it was implemented using a command line debugger and a variety of scripts. And I do say that I think it was prettier:

I’ll give them more time to improve the built in feature (and to enable it in MDT too). But I digress.
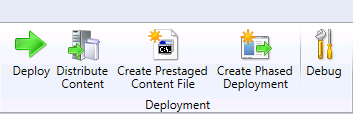
To use the new task sequence debugger, you have to set the TSDebugMode variable. As the docs describe, that can be done using a collection variable. But it can also be done by doing a “debug” deployment of the task sequence. This is a rather interesting process. You create a deployment, but instead of running the wizard via the “Deploy” button, you do it via the new “Debug” one:
But there’s no difference in the wizard, and nothing visibly different about the deployment either. Presumably that’s just a “preview” glitch that will be taken care of later. So what exactly is the difference? The best I can tell, this is being controlled by a new AdvertFlag value (0x40000000) on the SMS_Advertisement object created for the deployment:

That value isn’t yet documented, but given no other obvious differences between the debug and non-debug deployments, it seems a reasonable guess. (They are running out of bits in this bitmap. I guess when they run out, they can add no new features…)
Client-side, you can see the deployment (advertisement) is marked with a “[Debug]” string at the end of the name, so there is a visual indicator that this will automatically run the task sequence debugger.

And sure enough, it launches automatically when you run that task sequence, with all the advertised functionality.

You can run the task sequence step-by-step, set breakpoints, view variables, etc. Very useful. The only part I had trouble with: If a step fails, the task sequence quickly fails; I didn’t get an opportunity to re-run the step. Maybe another preview glitch?
In any case, try it out. It’s a useful tool.