
In the past, you could use the Microsoft Network Monitor to capture network traces, showing the gory details of all the network traffic to and from the machine. That utility morphed into the Microsoft Message Analyzer, and while it’s now too hard to use for simple network traces (I suggest WireShark instead), it did pick up some useful functionality to monitor what’s going on deep within Windows.
That monitoring includes being able to see into the MDM client activity, showing all the OMA-URI requests flowing from Intune (or any other MDM service) to the built-in MDM client in Windows 10. To peek at that, you can run the Microsoft Message Analyzer:
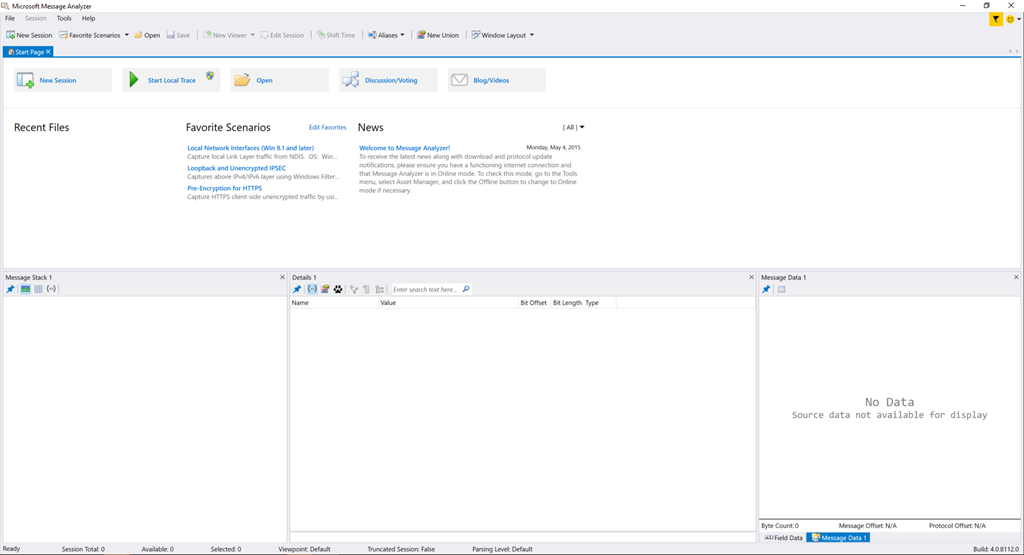
Click on “New Session” to start specifying the properties:

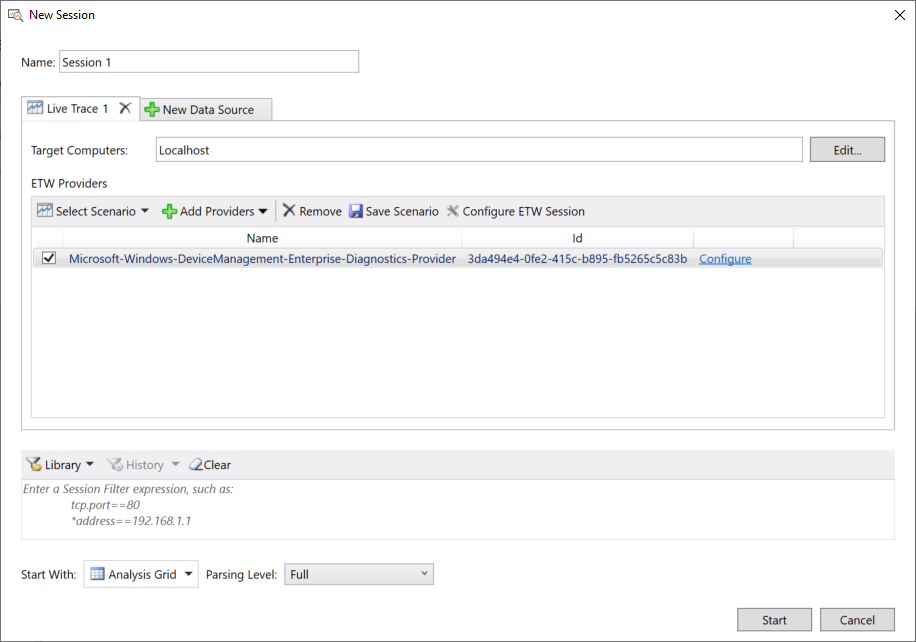
Click on “Live Trace” to specify what you want to capture:

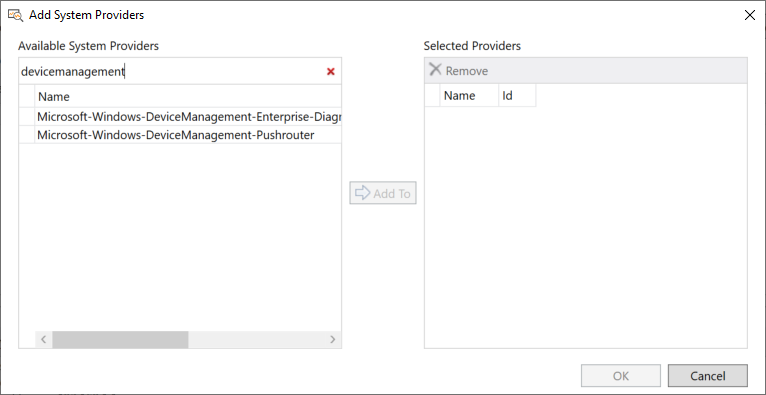
Then click “+ Add Providers” and choose “Add System Providers.”

Search for “DeviceManagement” to get matching providers:
Select the “Microsoft-Windows-DeviceManagement-Enterprise-Diagnostics-Provider”:
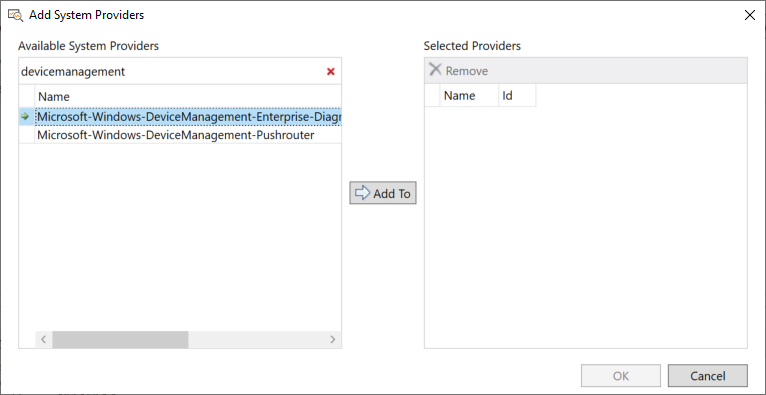
Then click “Add To” and OK to load the provider. Then click “Start” to begin tracing.
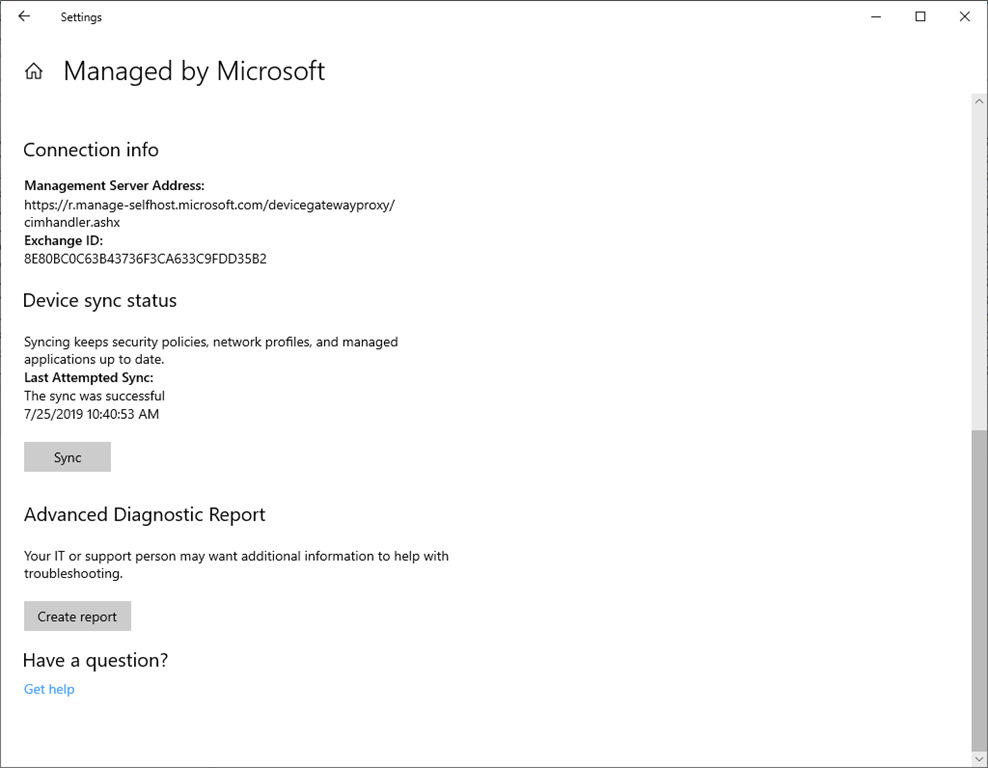
Next you need to generate some traffic. The easiest way to do that, on a device that is already enrolled in Intune (and in this case, also running Message Analyzer), is to open Settings and navigate to Accounts –> Access work or school. Click on the “Connected to” item corresponding to the enrollment, and then click the “Info” button.

Next, scroll down and click “Sync.”
That should generate a fair amount of traffic. With any luck, you’ll now see all sorts of “CSP Node Operation” entries:

Great, but the columns displayed aren’t the greatest, so let’s do a little rearranging. The blank columns aren’t very interesting, so right click on each of those and choose “Remove.” Then right click again and choose “Add Columns…”. Here’s where it gets a little more interesting. You can see in the list view that Message4 and Message5 look like interesting values, so those are what we want to add. You can search for those in the field chooser:

But there’s more than one match. How do you know which one to add? Look back on the left-hand side of the screen, near the center, at the “1 : Etw” entry, where you can see the specific EventID value:
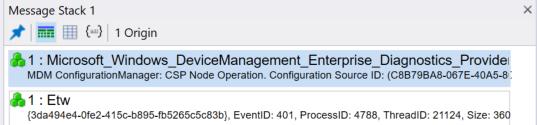
That shows “EventID: 401” so the field we want to add from the field chooser is the one under “Event_401”. Right click on that entry and choose “Add As Column.” Then do the same thing for “Message5”. You can then drag-and-drop to rearrange the columns, ending up with something like this:

Presto. Now you can see the conversations in all their gory details. There will be other sorts of events in the list too, showing how the client is parsing OMA-URI requests, performing licensing checks, and all sorts of other stuff too, but it’s the GetValue/SetValue requests that are most interesting. Have fun…


One response to “Want to watch the MDM client activity in real time?”
great post again, thanks for writing!
LikeLike