People have made fun of Microsoft’s progress bars for decades. We’ve all seen examples, e.g. file copies that show days, then minutes, then hours; “updating Windows” messages that sit for a long time on a particular percentage and then jump forward; etc. And certainly there are challenges with accurate calculations, especially when conditions change (e.g. network bandwith). As a result, I think a number of progress bars are somewhat fake — they show you that “yes, something is going on” and they march forward, but they don’t actually represent true progress.
But just when I thought I had seen it all, I encountered the Autopilot v2 (Autopilot device provisioning) progress bar. What I expected was something that counted up the number of items (e.g. apps plus scripts) and did a percentage based on that. But as I mentioned in my previous post, I saw something different when one of my app installs hung — the progress bar kept advancing, like it was just marking the passage of time. That implied that there was an aspect of elapsed time involved. But what if it was only tracking the passage of time and nothing else? To test that theory, I changed my Autopilot device preparation profile to specify the maximum time of 720 minutes:
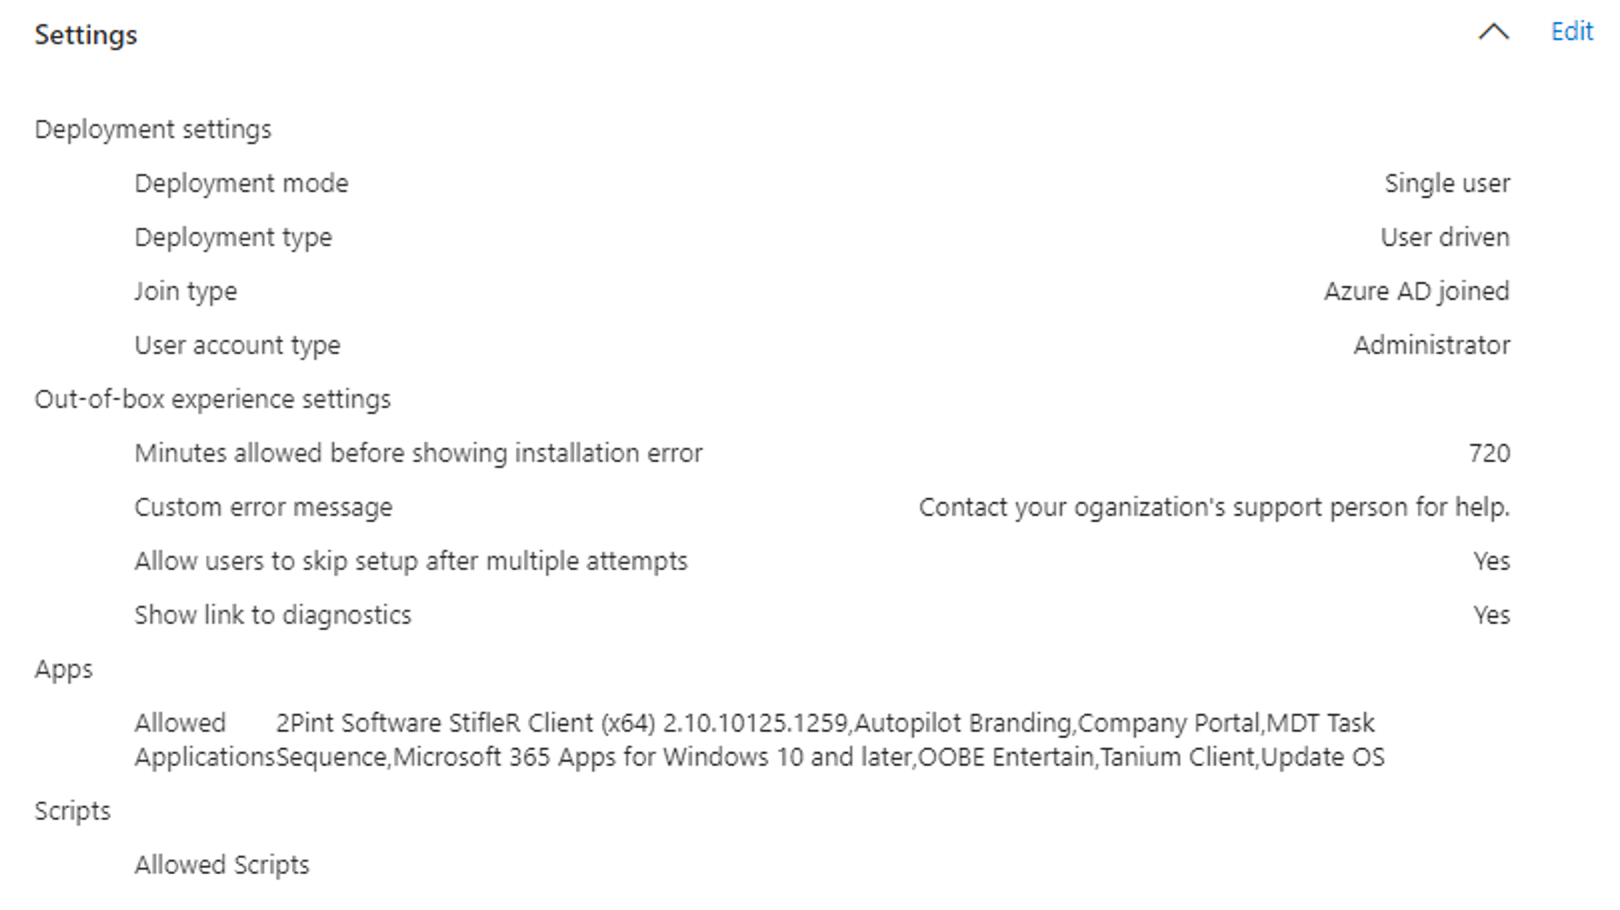
And then I provisioned a device. With the list of apps that I have configured, it routinely takes 11-12 minutes for the process to complete. How high would the percentage go before jumping to 100%? It goes to 1% pretty much right away, but it maxed out at 2% before jumping to 100%.
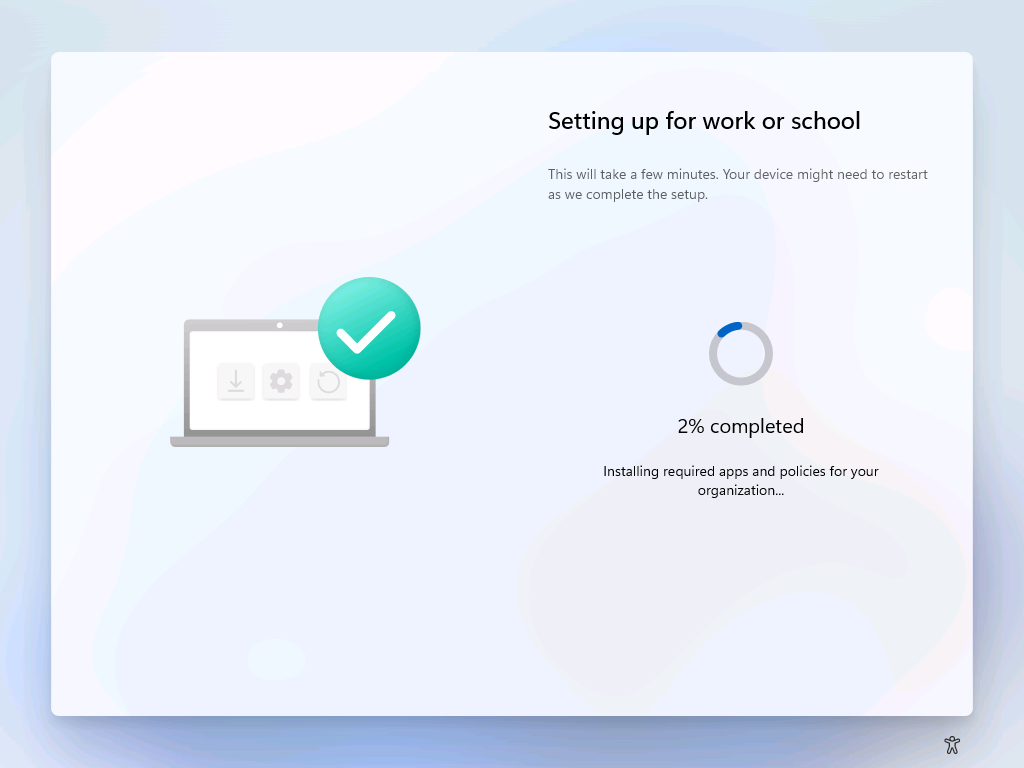
So where did that 2% come from? Simple math: 12 minutes elapsed divided by 720 minutes maximum = 1.66%, rounded up to 2%. It’s just telling me the percentage of the maximum time has elapsed — if it ever gets into the 90% range, that would mean you’re getting pretty close to your timeout.
That can’t really be, can it? Let’s try another test by changing the maximum time to something low, e.g. 15 minutes. I know this device will finish within that time, so that should be “safe” for this one machine (even if it’s not safe for the broader population of machines).
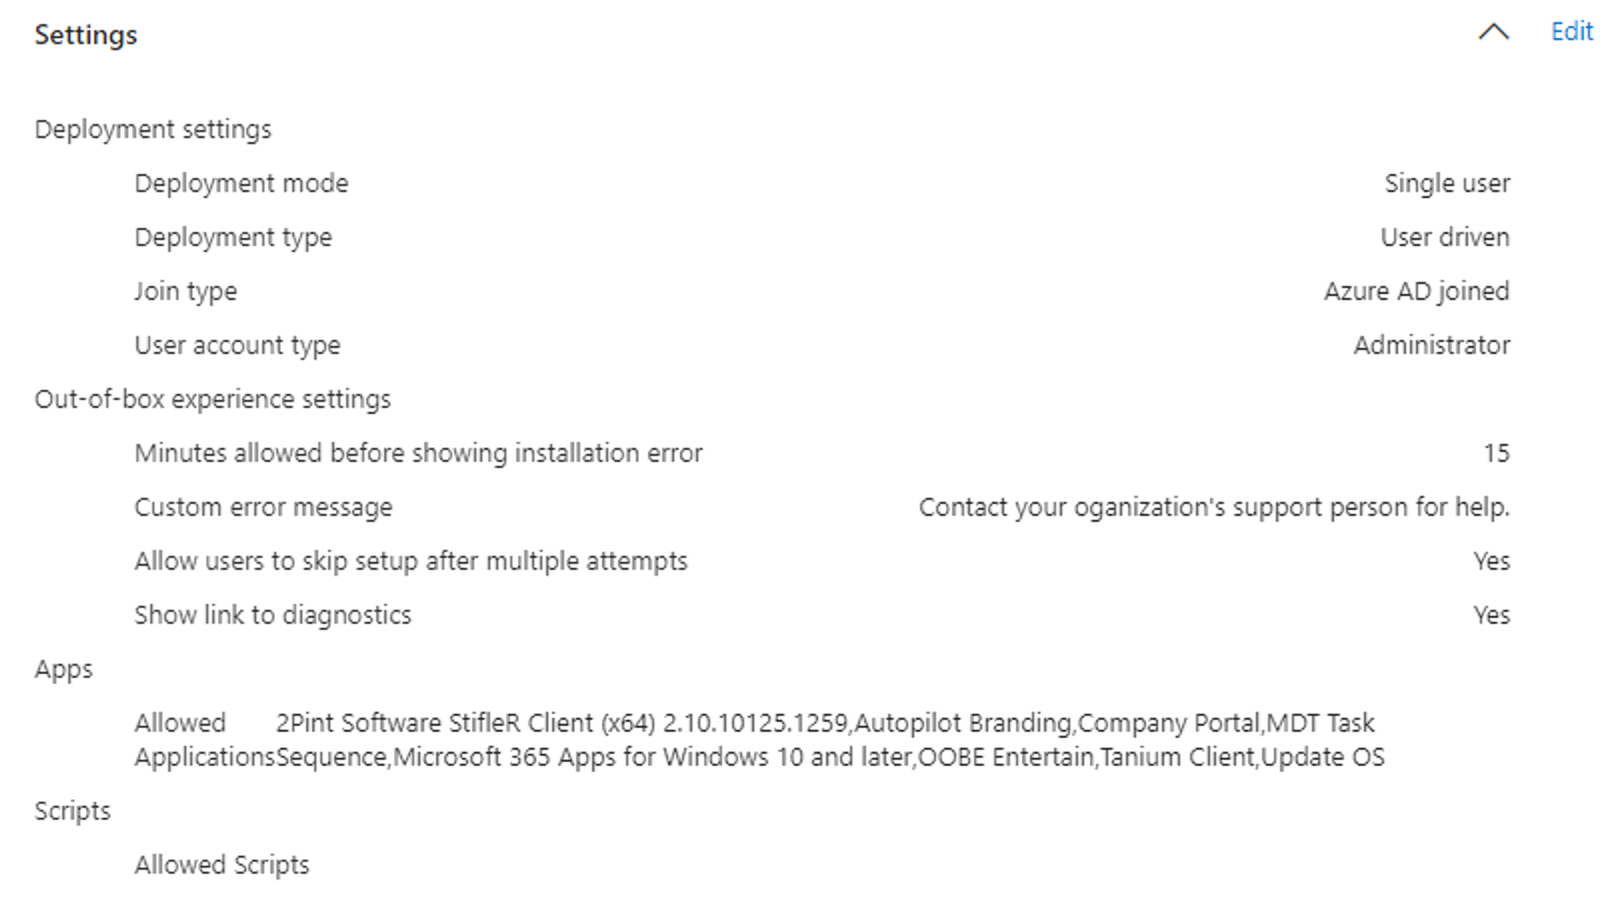
This time, I would expect the percentage to get into the 70’s or 80’s, since 12/15 = 80% of the available time. Sure enough, it made it to 77% before it jumped to 100%:
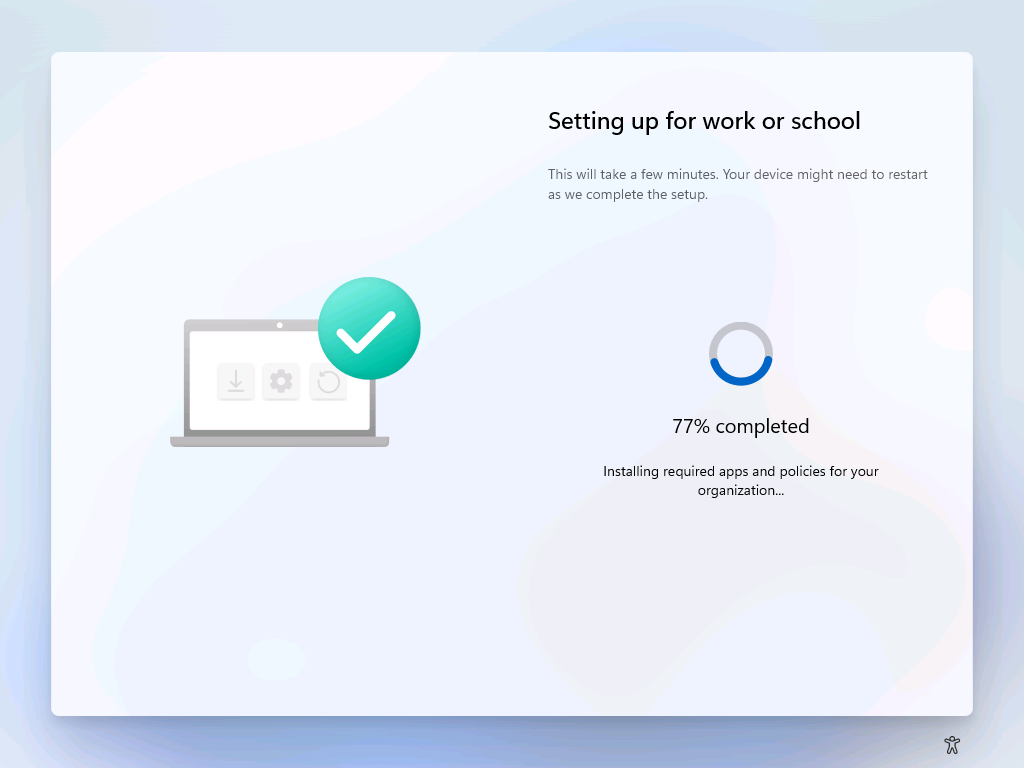
So this is indeed just a marker of passed time, showing you the percentage of your configured maximum execution time. Yes, it probably placates the end user who just looks at the spinning dial or walks away, but it’s not going to have any link to the remaining work that still needs to be done.
Does that mean you just set the maximum time value low? That’s always been the challenge with this ESP setting: You have to configure it to the worst case. What takes 15 minutes on a gigabit Ethernet connection might take two hours from a random coffeeshop, or even longer across a satellite link. As a result, values in “hours” are common even when “on the corp home office network” takes minutes. So it’s a bit of a no-win situation.
I’d love to see this get to a more intelligent state. Counting apps and scripts and calculating a percentage based on the number that are completed would be a reasonable step forward (especially if you could display the name of the app currently being installed, but that still doesn’t appear to be possible), but even that has challenges, e.g. some apps are tiny, others are huge. But given that you know the size of the apps and can measure the download speed, and the apps are configured with a maximum installation time, you could do even better — with some work. We can only dream…